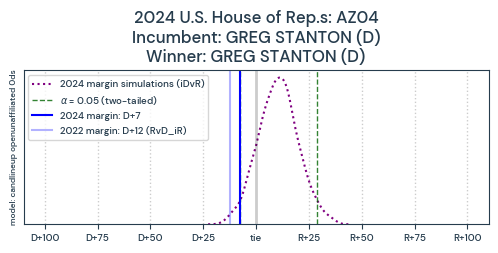
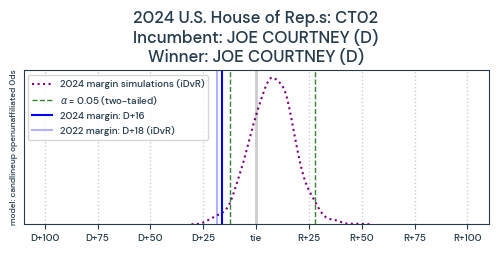
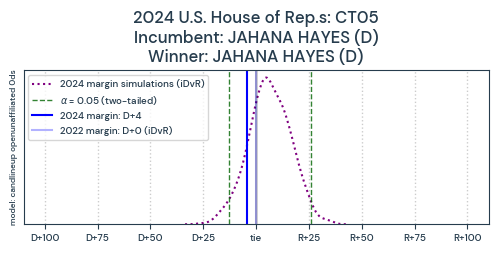
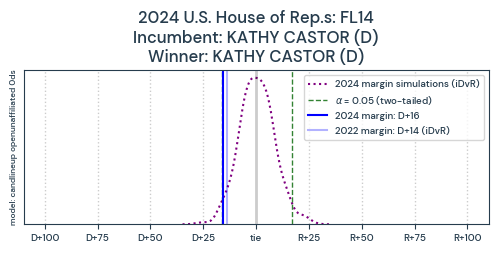
2024 U.S. House Elections Simulations: Review
We have been working hard over here tweaking predictions models for the November 2026 midterm elections. In this piece, we will review how well they perform on 2024 as test data using 2022 as a training set. We will only consider major party match-ups, obviously leaving out uncontested elections and saving same-party match-ups/major party vs third party match-ups for future investigation. To build these models, we use: 1) historical partisan primary turnout data by voter cluster to model partisan splits, 2) historical general election turnout data by voter cluster to model turnout, and 3) contest groupings based on features like incumbency status and party membership of the incumbent, whether or not the incumbent is running for re-election. Regarding the third point, you may notice notation like “iRvD” (incumbent Republican running against a Democrat) or “DvR_iD” (Democrat running against a Republican, incumbent Democrat not running). We ran a 10,000 simulation Monte Carlo using the best-performing model from a trial run, and it predicted outcomes we will simplify into four basic categories: 1) Republican win, 2) Democrat win, 3) Republican more likely, 4) Democrat more likely. (We did not assign any “tossups” so even though some of the simulation curves will look dead even between the candidates, we assigned the predicted win to whichever candidate had the mean margin value of the 10,000 simulations in their favor.) You will see visual examples of different outcome scenarios with respect to the model’s 95% confidence interval (i.e., the dashed green lines, the interval between which delineates where the actual result is predicted to fall 95 times out of 100 runs of the same election). Without further ado, an overview of prediction model performance for all 397 major-party match-ups from the 2024 U.S. House of Representatives elections!
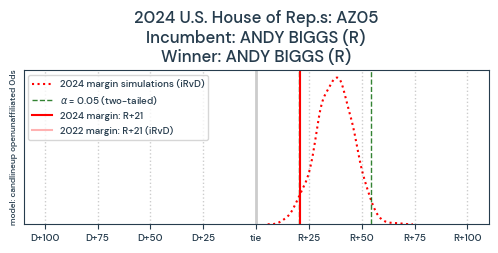
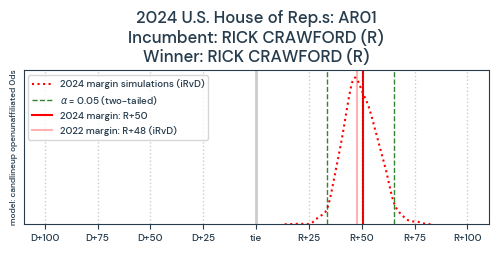
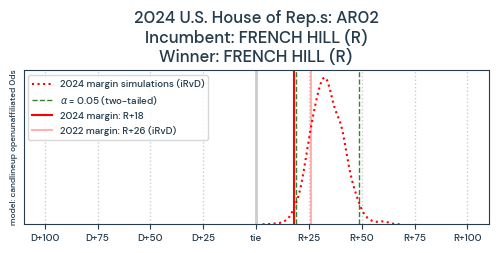
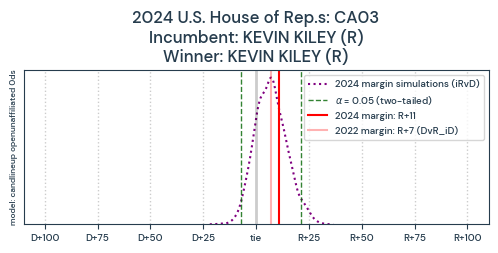
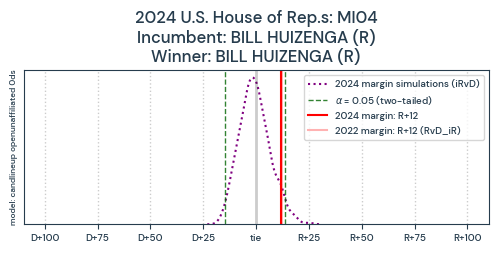
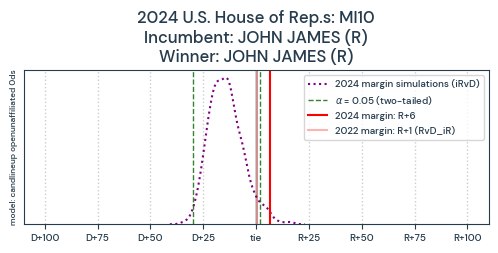
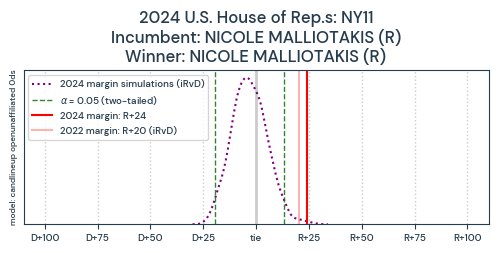
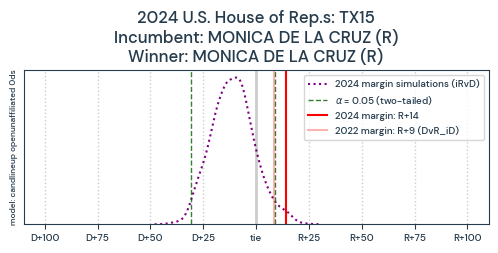
1) Prediction: Republican win (168 of 397)
Of the 168 contests in this result category, 166 resulted in a Republican win. Check the gallery below to see three straightforward examples of such contests. For AZ05, the 95% confidence interval runs from ~20 to the low 50’s on the Republican side and so not only is the “Republican win” prediction correct, but also the actual two-way margin falls within the confidence interval (we say, “two-way,” because any other candidate’s results besides the winner’s and runnerup’s are ignored in the total votes count; the statistic is calculated as follows: (candidate A - candidate B)/(candidate A + candidate B)). It’s the same situation for AR01, but notice the actual margin falls on the other side of the peak of the simulations distribution curve (dotted line); this configuration is more pivotal when the 95% confidence interval includes zero, which we will see farther down. Finally, notice in the third example our prediction is correct in predicting the Republican win, but the actual margin falls outside of the confidence interval.
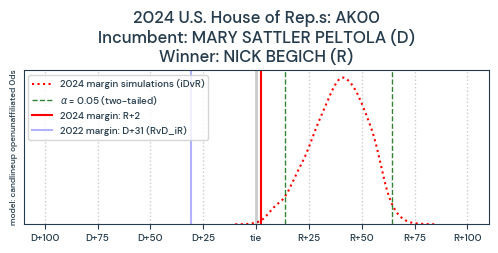
The 166 correct predictions in this category include four seat flips, shown below. (“AK00” is Alaska’s At-Large district.)
Finally, the two incorrect predictions in this result category are contests where a Democratic incumbent defeated a Republican challenger. These representatives have constituencies that appear more likely to support a Republican candidate under favorable conditions, e.g., candidate profile, campaign financing. See below.
2) Prediction: Democrat win (102 of 397)
All 102 contests in this result category did, indeed, result in a Democrat win. One of them was a seat flip, shown below.
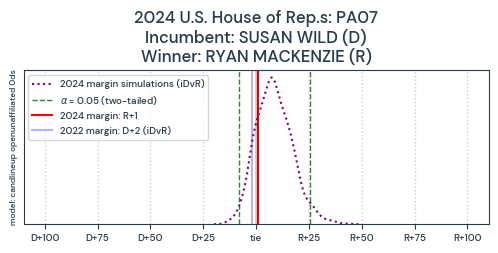
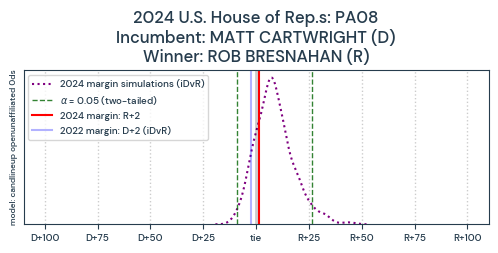
3) Prediction: Republican more likely to win (58 of 397)
Of the 58 contests in this category, 40 actual margins fell within the 95% confidence interval, but only 27 ended up on the predicted side of zero for a Republican win. First off, a representative example of one of those correct predictions below.
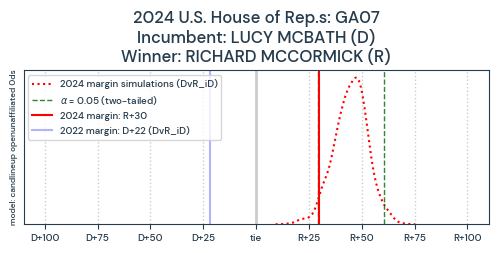
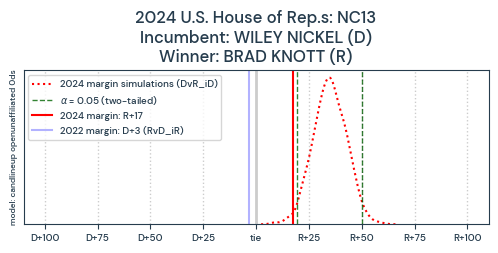
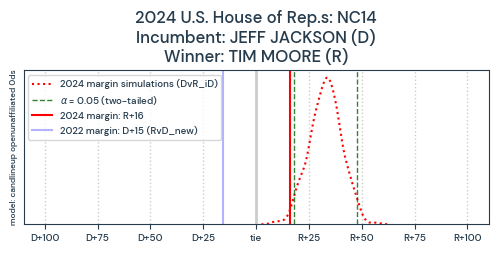
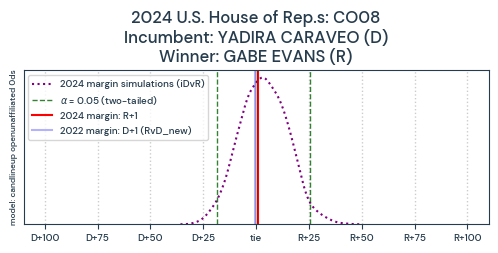
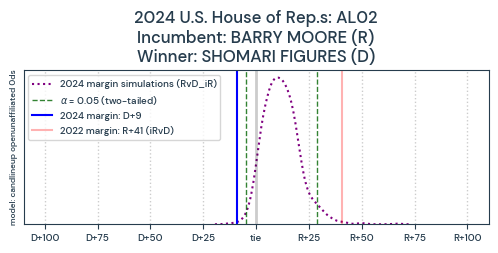
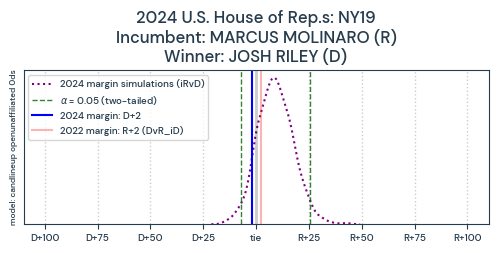
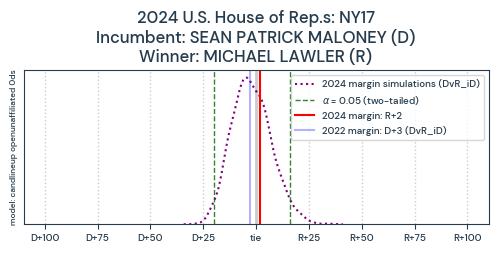
Three of the correct predictions were flipped seats (D to R) and two of the incorrect predictions were also flipped seats but in the other direction (R to D). All five of those are shown below. Notably, Shomari Figures performed very, very well in AL02.
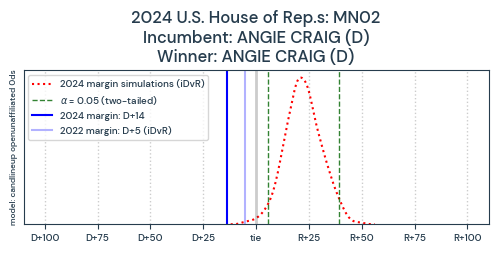
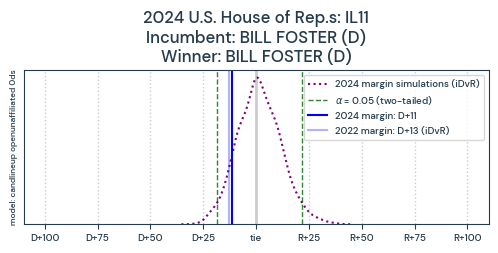
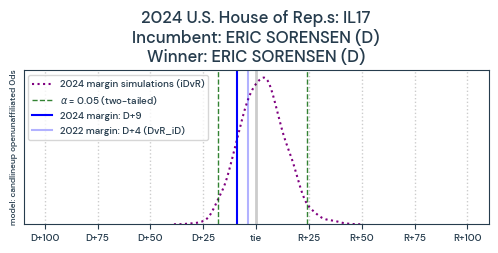
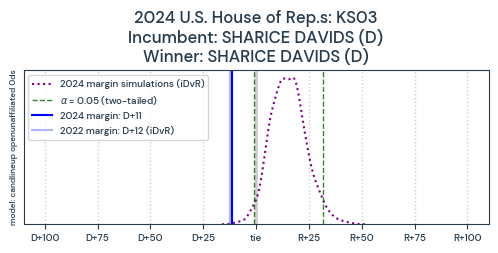
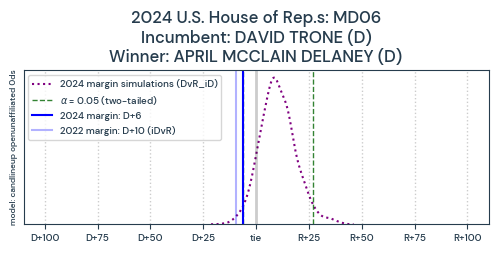
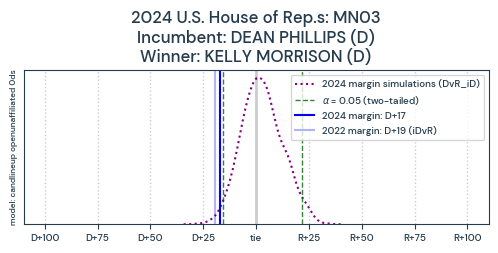
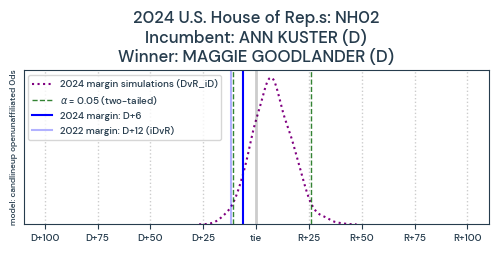
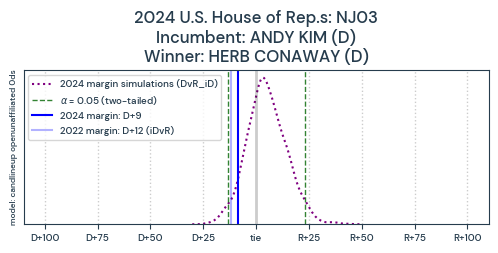
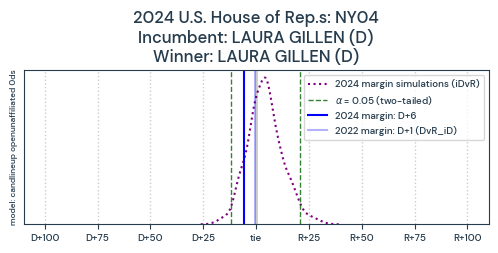
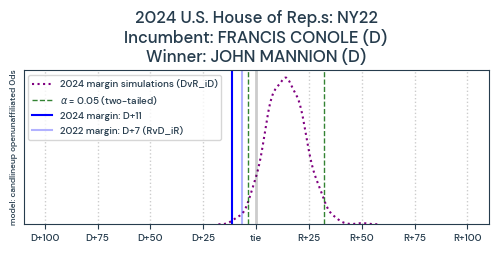
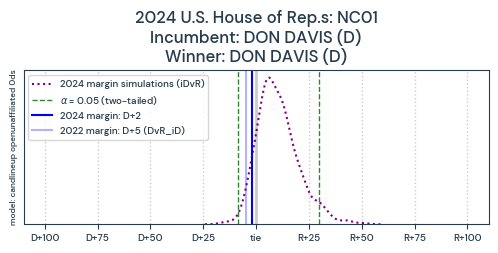
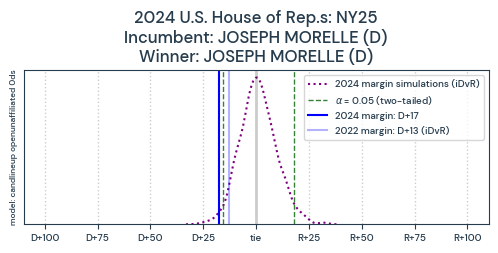
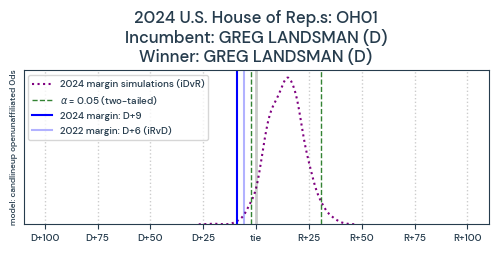
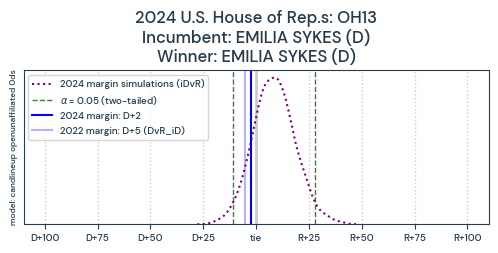
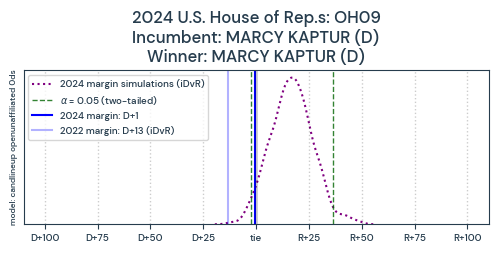
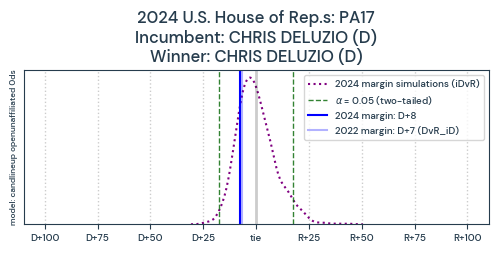
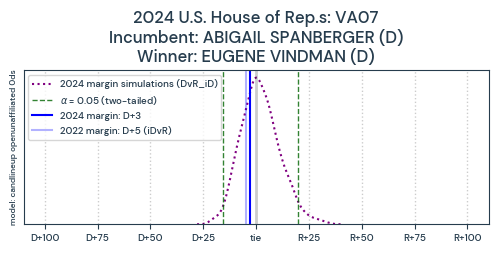
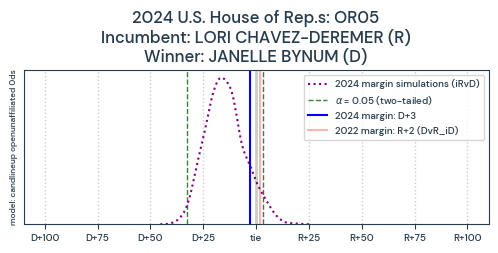
The rest of the incorrect predictions in this category are mostly Democratic incumbent winners (MD06, MN03, NH02, NJ03, NY22, and VA07 being the exceptions, where the incumbent Democrat did not run) in districts where the incumbents represented constituencies that ranged from what we would describe as absolute tossup to strong lean Republican. We imagine these representatives would fall under the most conservative Democrats in Congress by some metric like votes cast in the current session. We will display all of them here because they are the most notable collective anomaly in the 2024 set. We will review a smaller analogous group of Republicans in the following section.


4) Prediction: Democrat more likely to win (69 of 397)
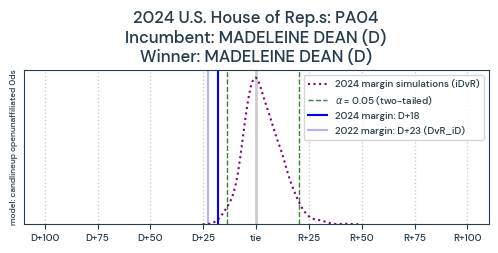
Of the 69 contests in this result category, we predicted 62 correctly. One representative example is shown below.
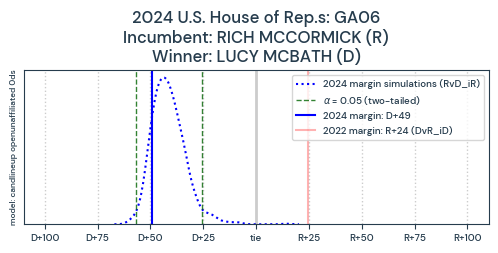
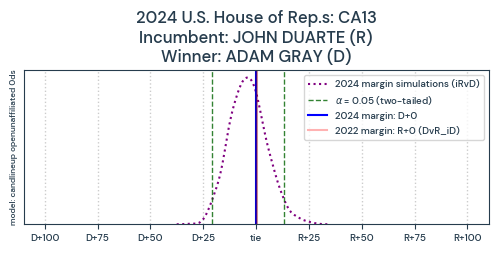
Five of the correct predictions were seat flips (R to D); there were an additional two seat flips we did not predict (D to R). All seat flips in this result category are shown below. CA13 was a brutal contest two elections in a row; looks like the district leaned slightly Democrat in 2024.
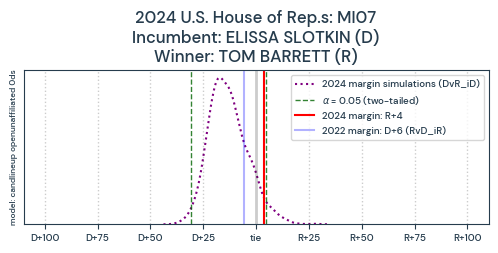
The other five incorrect predictions in this result category were predicted seat flips that did not flip. They appear to be the analog to the big group of conservative-looking Democrats mentioned previously; these are Republicans supported by constituencies that range from absolute tossup to strong lean Democrat. We show them all below.
Conclusion
Barring the very centrist-appearing candidates mentioned from both sides of the aisle — or the middle of the aisle, as it were — who are supported by constituencies that appear to be made of voters who would be more likely to support a candidate who is a member of the opposite major party, the model appears to work quite well. It predicted quite a few seat flips even within the 95% confidence interval. We will certainly take into account the groupings of anomalous incumbents for the 2026 forecasts and look out in particular for any changes in the 95% confidence intervals for those districts. Next piece coming soon with those predictions with a bit more digging into partisanship/turnout patterns of specific voter clusters. Please contact with any questions you have on particular contests, methodology, etc. by emailing contact at volsweep dot com. Thanks for reading!